The Dow Jones Industrial Average began the week trading at 10,100.81 but moved to a price high in the 10,438 area before ending the week trading slightly lower. The Dow Jones Industrial Average is above its 5, 10, 32, and 50 week moving averages but below its 200 week moving average. Downside support for the Dow Jones is at 9,917.41 with upside resistance at 10,729.89. The Dow ended the week trading at 10,402.35 +303.21 or 3.00% on the upside on lighter than average trading volume of 3.32 billion.
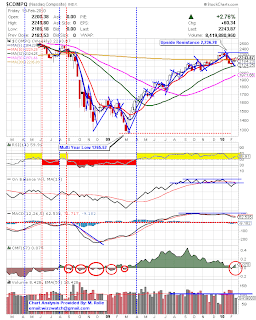
At the Nasdaq the tech weighed index advanced moving higher for the second week in a row as it continues to beat the S&P 500 as well as the Dow Jones Industrial Average. The Nasdaq opened the week trading at 2,200.38 but moved to a price low at 2,189.18 before ending the week trading higher. The index is above its 5, 10, 32, and 50 week moving averages. Downside support for the index is at 2,124.25 with upside resistance at 2,236.28. A break of downside support will take the Nasdaq much lower in the near term but as for now the index to move higher. The Nasdaq ened the week trading at 2,243.87 +60.34 or 2.76% on lighter than average upside volume of 8.4 billion. The average trading volume for the tech weighed index is 10.4 billion.
As for the Standard and Poors 500 it was the second best performer of the 3 major indices beating the Dow Jones Industrial Average. The S&P advanced to move above its 5 and 10 week moving averages for the first time in 4 weeks after it started its initial decline as of the second week of January 2010. The index is poised to move higher in the near term but volume will need to pick up in order to take the index much higher. The S&P 500 is currently above its 5, 10, 32 and 50 week moving averages but below its 200 week moving average. The 200 week moving average is in the 1,229.63 area but the first step is for the index is to break above upside resistance. Downside support for the S&P 500 is at 1,063.88 with upside resistance at 1,150.45. The S&P 500 ended the week trading at 1,109.17 up +33.66 or 3.13% on lighter than average upside trading volume of 14.03 billion. The average weekly trading volume for the S&P 500 is 20.24 billion.
By: Marlin Rolle
*** Please have a look at the charts below. ***


No comments:
Post a Comment
Note: Only a member of this blog may post a comment.